
Forex line trading is the practice of drawing trend lines on a price chart to read market direction, then using those lines to time entries, exits and stop-loss placement. It is one of the oldest tools in technical analysis, and one of the most misused — because a trend line is drawn by you, not calculated for you.
- Understanding Trend Lines
- Uptrend Lines
- Downtrend Lines
- Sideways / Ranging Markets
- Significance of Trend Lines in Forex Line Trading
- Extending Trend Lines
- Adjusting Trend Lines
- Setting Up Trend Lines: Tools and Time Frames
- Tools You Actually Need
- Choosing the Right Time Frame
- How to Draw a Trend Line: A Step-by-Step Approach
- Step 1: Recognise the Trend
- Step 2: Draw the Line
- Step 3: Validate the Line
- Step 4: Trade the Line
- Effective Trading Strategies Using Trend Lines
- Strategy 1: Trend Line Breakouts
- Strategy 2: Trend Line Bounces
- Strategy 3: The Break-and-Retest
- A Worked Example: Sizing the Trade
- Advantages and Disadvantages of Trend Lines
- When to Avoid Using Trend Lines
- 1. Around scheduled high-impact news
- 2. In extreme volatility
- 3. In the absence of a clear trend
- 4. During thin liquidity
- 5. When your indicators disagree
- Common Mistakes in Forex Line Trading
- Examples of Forex Line Trading Strategies
- Trading in an Uptrend
- Trading in a Downtrend
- Forex Line Trading from Malaysia and Singapore
- Session Timing — the Local Advantage
- The Regulatory Reality (Read This Before Funding an Account)
- Be Honest About the Base Rates
- Conclusion
- Frequently Asked Questions
The scale of the market is worth keeping in perspective. Global foreign exchange turnover hit US$9.6 trillion per day in April 2025, up 28% from three years earlier, according to the Bank for International Settlements Triennial Survey. You are drawing a line across the busiest market on earth. The line does not move the market; it only helps you describe what the market has already done.
This guide covers how to draw trend lines properly, how to validate them before risking money, three strategies that use them, a worked risk example with real numbers, and a section on what forex line trading actually looks like from Malaysia and Singapore — including the regulatory reality most guides skip.
Understanding Trend Lines
Trend lines visually represent where price has been finding buyers or sellers. They are drawn by connecting key swing points on a chart. There are three basic structures:
| Trend line type | What price is doing | How to draw it | How to trade it |
|---|---|---|---|
| Uptrend line | Higher highs and higher lows | Connect the swing lows, sloping up, line sits below price | Look for buys when price pulls back to the line |
| Downtrend line | Lower highs and lower lows | Connect the swing highs, sloping down, line sits above price | Look for sells when price rallies into the line |
| Sideways / range | Price oscillates in a band, no directional bias | Two roughly horizontal lines: support below, resistance above | Fade the edges, or wait for a break — trend-following fails here |
Uptrend Lines
An uptrend is a sequence of higher highs and higher lows. You draw the line by connecting the lows. Each time price returns to that rising line and holds, buyers have defended a slightly higher price than last time — which is the definition of an uptrend still being intact.
Downtrend Lines
A downtrend is a sequence of lower highs and lower lows. You connect the highs, and the resulting descending line marks where sellers have repeatedly stepped in earlier than before.
Sideways / Ranging Markets
Price fluctuates within a band with no clear direction. Buyers and sellers are roughly in balance. This is the condition in which trend lines are least useful, and it is far more common than beginners expect — a currency pair can spend weeks going nowhere.
Significance of Trend Lines in Forex Line Trading

Extending Trend Lines
A trend line only becomes tradeable once you extend it forward. The projection is what gives you a price level to plan around before price arrives there.
An upward-sloping line projects forward a moving support zone where buying interest has previously appeared. A downward-sloping line projects a moving resistance zone. Neither is a guarantee — they are levels at which you have a reason to pay attention, prepare an order, and know in advance where you would be wrong.
Adjusting Trend Lines
Markets change, so trend lines are living objects. As new swing highs or lows form, the line has to be redrawn to reflect the current price structure.
Two rules keep this honest:
- Redraw when structure changes, not when your position is losing. Moving a line to keep a bad trade alive is not analysis, it is rationalisation.
- Keep the old line on the chart. Broken trend lines frequently flip roles — old support becomes resistance and vice versa — and that flip is often the cleanest signal the line ever gives you.
Setting Up Trend Lines: Tools and Time Frames
Trend lines are free to draw, so the tooling question is really about chart quality, data reliability and how well the platform lets you manage risk.
Tools You Actually Need
- A trading platform. MetaTrader 5 is now the default: MetaQuotes stopped issuing new MT4 licences to brokers years ago, and by 2026 roughly two-thirds of brokers offer MT5 while MT4 sits in maintenance mode with no new features. MT4 still works fine for drawing lines, but if you are choosing today, choose MT5 — or your broker’s own web platform. See our guide to the best forex brokers in Malaysia for what is available locally.
- Charting software. Broker charts are adequate; dedicated charting is better for drawing, saving and syncing lines across devices. TradingView is the common choice — our TradingView review covers what each plan actually unlocks, and our roundup of the best technical analysis tools compares the alternatives.
- A small set of confirming indicators. Moving averages, RSI and Bollinger Bands are the usual companions. Two is plenty. Six indicators on one chart is not analysis, it is noise — and they will contradict each other at exactly the moment you need a decision.
- A reliable data feed. Spot forex is decentralised, so your broker’s candles are their candles. Two brokers can print slightly different highs and lows on the same pair, which means your trend line can be valid on one feed and broken on another. Draw and trade on the same feed you execute on.
Choosing the Right Time Frame
Time frame choice does more to determine your results than the line itself. Longer time frames produce fewer but more reliable lines; shorter time frames produce many lines, most of which mean nothing.
| Trading style | Trend line time frame | Entry time frame | Typical hold | Realistic screen time |
|---|---|---|---|---|
| Scalper | H1 | M1 – M5 | Minutes | Continuous, session-bound |
| Day trader | H4 | M15 – H1 | Hours, flat by day’s end | 3–6 hours a day |
| Swing trader | Daily (D1) | H1 – H4 | Days to weeks | 20–30 min a day |
| Position trader | Weekly (W1) | Daily | Weeks to months | A few hours a week |
The multi-time-frame rule: draw the line on the higher time frame, execute on the lower one. A daily trend line tells you the direction; an H1 chart tells you where to get in with a tight stop. Drawing and entering on the same chart is how traders end up with stops so wide the trade is not worth taking.
If you are still deciding whether short-term trading suits you at all, our comparison of trading vs investing is a more useful starting point than any chart technique.
How to Draw a Trend Line: A Step-by-Step Approach
Step 1: Recognise the Trend
Before drawing anything, classify the market:
- Uptrend: higher highs and higher lows.
- Downtrend: lower highs and lower lows.
- Range: neither pattern holds.
If you cannot classify it in ten seconds, it is a range. Move to another pair.
Step 2: Draw the Line
- Find two clear swing points — pivot lows for an uptrend, pivot highs for a downtrend.
- Connect them with a straight line and extend it to the right.
Two points draw a line. Three points confirm one. As BabyPips puts it, only two points are needed, but the more touches the line has, the stronger it is. Until price has respected the line a third time, treat it as a hypothesis rather than a level.
Wicks or bodies? Both conventions are defensible — what matters is that you pick one and apply it consistently. Connecting wicks captures the true extremes; connecting bodies filters out single-tick spikes and stop hunts. Switching between the two mid-analysis is how people convince themselves any line is valid.
Step 3: Validate the Line
Run it through this checklist before you risk anything:
| Check | What you want | Red flag |
|---|---|---|
| Touch count | 3 or more distinct touches | Only 2 — unconfirmed |
| Spacing of touches | Separated by meaningful swings | Three touches clustered in a few candles |
| Angle | Roughly 30°–45° on a standard chart | Near-vertical — unsustainable, breaks fast |
| Clean fit | Line does not slice through candle bodies | Price repeatedly closing the wrong side of it |
| Higher time frame agreement | Daily and H4 point the same way | H4 uptrend against a daily downtrend |
| Confluence | Line coincides with a horizontal level, round number or moving average | Line floating in empty space |
Confluence is the single biggest upgrade most traders can make. A trend line that happens to land on a prior horizontal support and a round number like 1.1000 is a genuinely different proposition from a trend line sitting on its own.
Step 4: Trade the Line
Once validated, use it to define three things before entry: where you get in, where you are wrong, and where you take profit. If you cannot state all three in one sentence, you are not ready to click.
Effective Trading Strategies Using Trend Lines
Strategy 1: Trend Line Breakouts
A break of an established trend line suggests the balance between buyers and sellers has shifted.
- Bullish break: price closes above a descending trend line, hinting the downtrend has stalled.
- Bearish break: price closes below an ascending trend line, hinting the uptrend has stalled.
An important correction on “confirm with volume.” Most trend line guides tell you to confirm breakouts with rising volume. In spot forex that advice needs a caveat: because the market is decentralised with no central exchange, there is no true consolidated volume. What your platform labels “volume” is tick volume — the number of price updates, not the money traded. Tick volume measures the frequency of participation, not its size, and it differs between brokers and liquidity feeds. It is a rough proxy for activity, and useful as such, but it is not the volume confirmation that equity traders rely on.
More reliable confirmation in forex:
- Candle close, not candle touch. Wait for a full close beyond the line on your chosen time frame.
- Momentum agreement. RSI or MACD moving with the break rather than diverging against it — see our guide to spotting bullish and bearish divergence, which applies identically to FX charts.
- Session context. A break during the thin Asian session is far less meaningful than one during the London–New York overlap.
Strategy 2: Trend Line Bounces
Trading with the trend as price returns to the line. In an uptrend, look for longs as price pulls back to ascending support; in a downtrend, look for shorts as price rallies into descending resistance.
Bounces generally offer better risk-to-reward than breakouts because your stop can sit just beyond a defined line rather than beyond a whole candle range. Wait for a rejection signal — a pin bar, engulfing candle, or simply a failure to close through — before entering.
Strategy 3: The Break-and-Retest
After a genuine break, price often returns to retest the broken line from the other side. This is usually the highest-quality entry of the three, because the retest either confirms the break (old support now acting as resistance) or invalidates it quickly and cheaply.
- How to trade it: wait for the break, then wait again for the retest. Enter on the rejection.
- Why it works: it filters out the false breaks that punish traders who chase the initial move.
- The cost: perhaps a third of breaks never retest. You will miss those. That is the trade-off you accept in exchange for a much better strike rate on the ones you do take.
A Worked Example: Sizing the Trade
Analysis without position sizing is just an opinion. Here is the arithmetic on a trend line bounce, using round numbers.
Setup: account of US$5,000. EUR/USD in an uptrend on the daily chart. Price pulls back to the ascending trend line at 1.0850 and prints a bullish rejection candle on H4.
| Step | Calculation | Result |
|---|---|---|
| 1. Risk per trade | 1% of $5,000 | $50 |
| 2. Stop distance | Entry 1.0850, stop 1.0800 (below the line) | 50 pips |
| 3. Position size | $50 ÷ (50 pips × $10 per pip per standard lot) | 0.10 lot (1 mini lot, $1/pip) |
| 4. Target | 1.0950 — prior swing high, 100 pips away | $100 profit, 2:1 R:R |
| 5. Notional exposure | 0.10 lot = €10,000 ≈ $10,850 | ~2.2:1 effective leverage |
Note what step 5 reveals. A properly sized trade uses roughly 2:1 leverage — nowhere near the 20:1 or 30:1 ceilings regulators impose. The leverage cap is almost never your binding constraint; your stop distance is. Traders who feel restricted by leverage limits are usually risking far too much per trade, not being held back by regulation.
At 1% risk, a five-loss streak costs you about 5% of the account. At 10% risk — which plenty of beginners run without thinking about it — the same five losses cost you 41%, and you now need a 70% gain just to break even. That asymmetry, not chart-reading skill, is what separates accounts that survive from accounts that do not.
Advantages and Disadvantages of Trend Lines
| Strengths | Weaknesses |
|---|---|
| Fast trend identification — one line tells you direction at a glance | Subjective — ten traders draw ten slightly different lines on the same chart |
| Defines entries and exits at specific prices, not vague zones | False breaks are common, especially on lower time frames |
| Natural stop placement — the line itself tells you where you are wrong | Lagging by construction — you need two swings before you can draw anything |
| Works on any time frame and any instrument | Useless in ranges, which is a large share of the time |
| Free — no subscription, no indicator, no data purchase | Invites over-reliance at the expense of fundamentals and risk control |
When to Avoid Using Trend Lines
1. Around scheduled high-impact news
Central bank decisions, CPI releases and non-farm payrolls can move a pair through several trend lines in seconds, with spreads widening and slippage on stops. Check an economic calendar before entering; if a tier-one release lands within the hour, either stand aside or size down deliberately.
2. In extreme volatility
When average true range doubles, the stop distance that made sense last week is now inside the noise. Either widen the stop and cut position size proportionally, or don’t trade.
3. In the absence of a clear trend
Ranging markets produce trend lines that break constantly in both directions. Horizontal support and resistance is the better tool here.
4. During thin liquidity
Late Friday, the Asian session on non-JPY pairs, and the days around major holidays all produce erratic price action that respects nothing. Fewer participants means levels get pierced on very little real interest.
5. When your indicators disagree
If the trend line says buy and momentum, higher time frame and market structure all say otherwise, the answer is not to find a sixth indicator that agrees with you. The answer is no trade.
Common Mistakes in Forex Line Trading
- Forcing the line to fit. If you have to squint, it is not a trend line. The market does not owe you a setup today.
- Drawing on a cluttered chart. Five trend lines on one chart guarantees price will always be near one of them, which means the lines have stopped carrying information.
- Trading the touch instead of the reaction. Price touching a line is not a signal. Price touching a line and being rejected is.
- Moving the stop away from the line. The line defined where you were wrong. If it breaks and you widen the stop, you have replaced a plan with hope.
- Ignoring the spread and swap. A 3-pip spread on a 15-pip scalp is 20% of the move gone before you start, and holding overnight adds swap charges. Trend lines say nothing about your costs.
- Trading steep lines. A near-vertical trend line reflects a move that cannot continue at that pace. It will break — the only question is when, and it usually breaks well before the trend actually ends.
- Confusing “the line held” with “I was right.” Over a small sample, a losing method can look brilliant and a sound one can look broken. Judge the process over 50+ trades, not the last three. Our piece on investor psychology covers why this is so hard to do in practice.
Examples of Forex Line Trading Strategies
Trading in an Uptrend
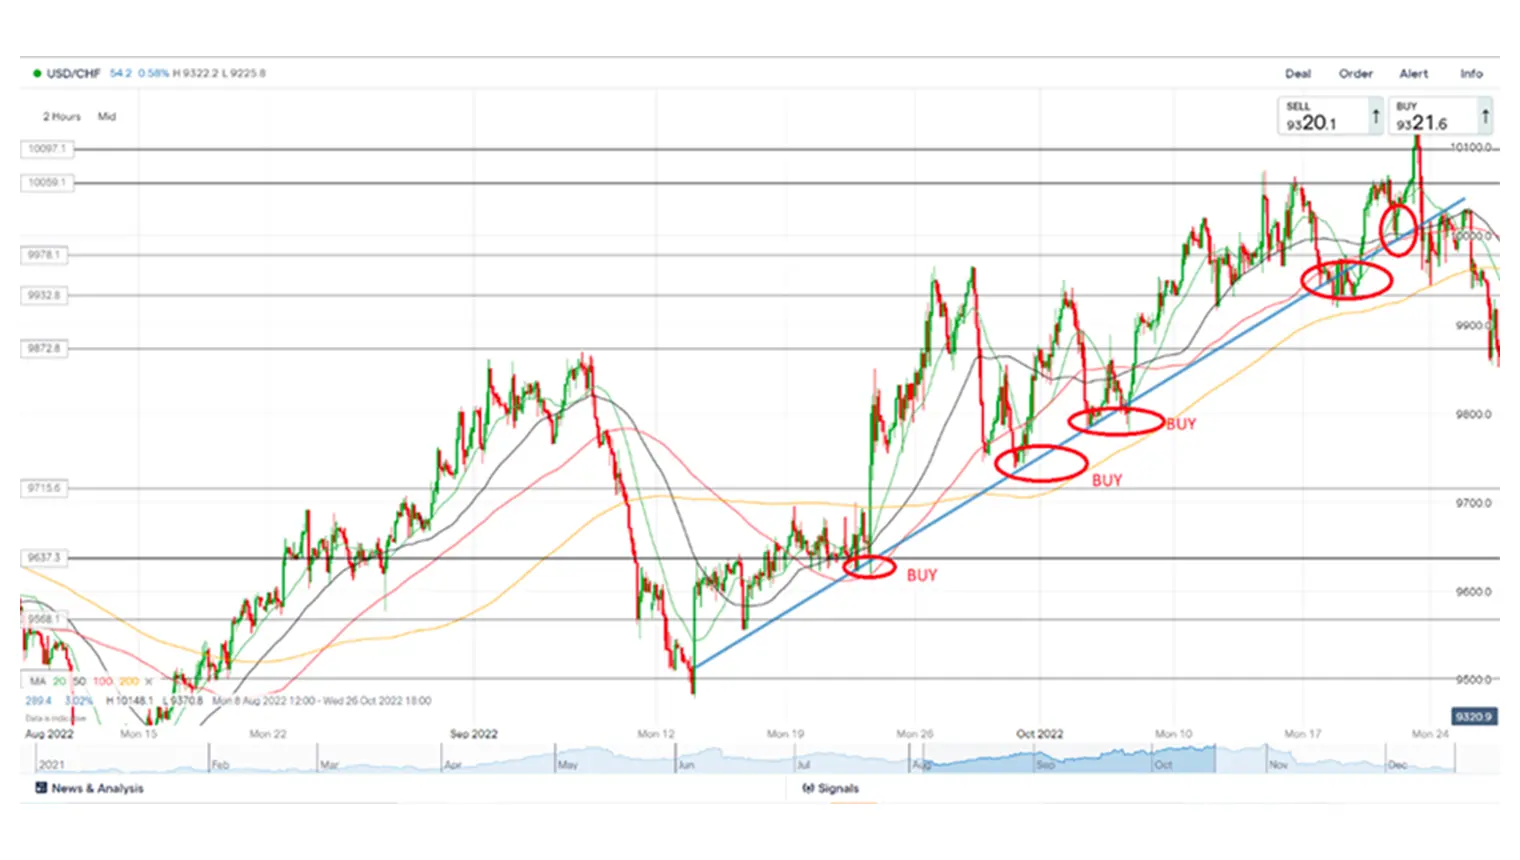
The goal is to buy retracements into ascending support:
- Trend identification: confirm higher highs and higher lows.
- Line drawing: connect at least two significant swing lows; wait for a third touch to confirm.
- Entry: buy when price retraces to the line and shows rejection.
- Stop loss: below the line, with room for a wick — not one pip under it, where the stop hunters live.
- Target: prior swing highs or horizontal resistance, aiming for at least 2:1.
Example: USD/CHF (2-hour chart). The pair held a consistent uptrend with three confirmed touches on ascending support. Each retracement offered a buying opportunity, with stops just below the line and targets at the horizontal resistance zones marked above.
Trading in a Downtrend
The mirror image, using descending resistance to time sells:
- Trend identification: confirm lower highs and lower lows.
- Line drawing: connect at least two significant swing highs.
- Entry: sell on pullbacks into the descending line.
- Stop loss: above the line, beyond the recent swing high.
- Target: prior swing lows or horizontal support.
Example: US Crude. In a clear downtrend, the descending line acted as resistance and each pullback into it offered a selling opportunity, with stops slightly above the line and targets at prior support.
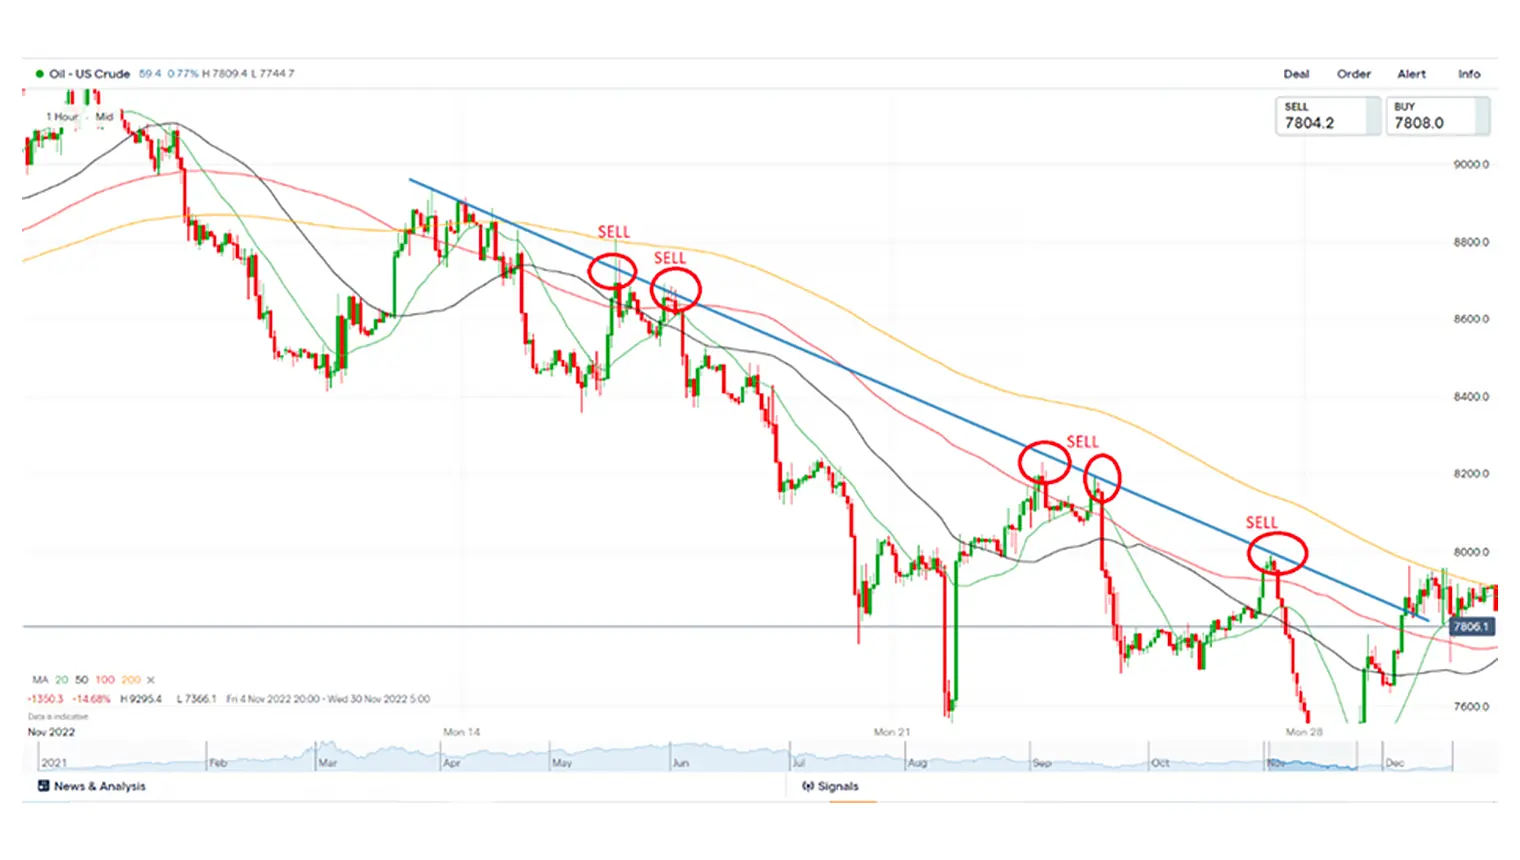
Note that the same technique works on crude oil as on USD/CHF. Trend lines are instrument-agnostic — which is both their appeal and a reason to be sceptical of anyone selling a “proprietary” trend line system.
Forex Line Trading from Malaysia and Singapore
Two things matter more for MY/SG traders than any charting technique: when you can realistically trade, and who you are legally allowed to trade with.
Session Timing — the Local Advantage
Malaysia and Singapore both sit at UTC+8, which puts the most liquid window of the entire trading day in the evening. This is the single biggest structural advantage of trading FX from this region: the best liquidity arrives after work.
| Session | MYT / SGT (Oct–Mar) | MYT / SGT (Mar–Oct, DST) | Character |
|---|---|---|---|
| Tokyo (Asian) | 08:00 – 17:00 | 08:00 – 17:00 | Quiet except JPY, AUD, NZD pairs; ranges dominate |
| London (European) | 16:00 – 01:00 | 15:00 – 00:00 | Largest FX centre; trends often begin here |
| New York (US) | 21:00 – 06:00 | 20:00 – 05:00 | US data releases; strong follow-through |
| London–NY overlap | 21:00 – 01:00 | 20:00 – 00:00 | Deepest liquidity, tightest spreads, cleanest breaks |
Tokyo does not observe daylight saving, so its local times are stable; London and New York shift by an hour between roughly late March and late October, which moves everything one hour earlier in MYT/SGT. Practical implication: if you hold a day job, the overlap is genuinely accessible — but a 21:00–01:00 routine is not sustainable five nights a week. Swing trading off daily trend lines, checked once in the evening, fits most people’s lives far better than day trading does.
The Regulatory Reality (Read This Before Funding an Account)
Malaysia. Neither Bank Negara Malaysia nor the Securities Commission licenses the retail spot-forex and CFD products that offshore brokers market to Malaysians. The SC licenses onshore capital-market activity — including currency futures on Bursa Malaysia Derivatives — but those regulated products are largely aimed at sophisticated investors, not retail beginners. Dealing with an unlicensed platform falls outside Malaysian investor protection entirely: if withdrawals are frozen or funds disappear, local enforcement generally cannot help you. Check any operator against the SC Investor Alert List before depositing. Appearing on that list is not proof of fraud, but it does confirm the operator holds no Malaysian licence. Since November 2025 the SC has also tightened rules on financial influencers promoting unlicensed brokers, with substantial penalties attached.
Singapore. The position is clearer. Only brokers holding an active MAS Capital Markets Services licence may offer leveraged FX or CFDs to Singapore retail clients, and those brokers must provide segregated client money, negative balance protection, and leverage capped at 20:1 on major currency pairs.
| Regulator | Jurisdiction | Max retail leverage (major FX) | Negative balance protection |
|---|---|---|---|
| MAS | Singapore | 20:1 | Yes |
| ESMA | European Union | 30:1 | Yes |
| FCA | United Kingdom | 30:1 | Yes |
| ASIC | Australia | 30:1 | Yes |
| CFTC / NFA | United States | 50:1 | Not mandated equivalently |
| BNM / SC | Malaysia | No retail spot-FX licensing regime | Not applicable |
Offshore brokers advertising 500:1 or 1000:1 leverage are, by definition, not operating under any of the regimes above. High advertised leverage is a marketing signal about the broker’s regulator, not a feature you benefit from — as the worked example showed, a correctly sized trade rarely uses more than about 3:1.
Be Honest About the Base Rates
Brokers regulated in the EU and UK are required to publish the share of their retail clients who lose money. Those disclosures consistently land in the 70–85% range, and UK broker disclosures compiled in 2026 average around 70%. Any material presenting trend lines — or any other technique — as a reliable income stream is arguing against the regulator-mandated data its own industry publishes.
This does not make forex line trading useless. It does mean treating it as a skill to be developed slowly on a demo account and then small size, funded only with money you can afford to lose entirely. If your goal is to build wealth rather than to trade, our guide to day trading stocks and our broader trading vs investing comparison set out the alternatives.
Conclusion
Forex line trading works best when you treat the trend line as a decision framework rather than a prediction. Draw it on a higher time frame, demand at least three touches, look for confluence with horizontal levels, and let the line define your stop before you think about profit.
The technique is not the hard part — most traders can draw a competent trend line within a week. What separates results is everything around it: sizing each trade so a losing streak is survivable, staying out of ranging and news-driven conditions, and accepting that a valid line will still fail a meaningful share of the time.
Start on a demo account, keep a written record of every line you draw and how it resolved, and only move to live capital once your process is boring. If you want to automate parts of the workflow, our review of the best AI trading bots covers what these tools can and cannot realistically do.
Market structure, leverage caps and broker licensing details verified July 2026. Regulations and broker terms change — confirm the current position with the provider and the relevant regulator before you trade.
Frequently Asked Questions
Disclaimer: This article is published by KayaToday for general information and education only. It is not financial advice and does not account for your objectives, financial situation or needs. Leveraged forex and CFD trading carries a high risk of losing money rapidly; the majority of retail accounts lose money. Figures and regulatory details were accurate at the time of writing and may change. Consider seeking advice from a licensed financial adviser before trading.