
Divergence is one of the most respected—and most misused—signals in technical analysis. Used well, it can warn you that a trend is running out of steam before the price actually turns. Used carelessly, it produces a stream of false alarms: analyses of divergence trading suggest that roughly 30–40% of raw signals fail when traders act on them without confirmation.
- What Is Divergence?
- The Indicators That Reveal Divergence
- Bullish Divergence
- Bearish Divergence
- The Four Types of Divergence
- Regular Divergence: Signal of Potential Trend Reversal
- Hidden Divergence: Signal of Trend Continuation
- How to Spot Divergence in Crypto: Step by Step
- Common Divergence Trading Mistakes (and How to Avoid Them)
- Real Divergence Examples in the Crypto Market
- Managing Risk When Trading Divergence
- Conclusion
- Frequently Asked Questions
In cryptocurrency markets, where momentum swings hard in both directions, two forms of this signal do most of the heavy lifting: bullish divergence and bearish divergence. This guide explains what each one means, the indicators that reveal them, the four divergence types every trader should recognise, and—just as importantly—the mistakes that turn a promising signal into a losing trade.
Key Takeaways
- 📉 Divergence is a disagreement between price and a momentum indicator (such as RSI or MACD). It flags that a trend may be about to reverse—or that it still has room to run.
- 🔍 Bullish divergence hints at a potential move higher, while bearish divergence warns of a possible decline—helping you time entries and exits.
- 📊 Regular divergence signals a trend reversal; hidden divergence signals trend continuation.
- 🛠️ Never trade divergence in isolation. Confirm it with price structure, volume, or a second oscillator—and always use a stop-loss.
- 📈 Divergence on higher timeframes (4-hour and daily) is far more reliable than on 1–15 minute charts.
What Is Divergence?
Before going further into bearish and bullish divergence, it helps to be clear on what divergence actually is.
Simply put, divergence is a difference in direction between price movement and a technical indicator, such as the Relative Strength Index (RSI) or the Moving Average Convergence Divergence (MACD). When price is making new highs but momentum is quietly fading—or price is making new lows while momentum strengthens—the two are “diverging.” That disagreement often warns that the current trend is losing conviction, which is why divergence is used as a confirmation signal for potential trend changes rather than a standalone trigger. You can read a fuller technical definition on Investopedia’s divergence explainer.
Divergence can be applied to almost any liquid market—crypto, stocks, gold, forex, and derivatives tied to physical assets such as oil and wheat—which makes it a versatile tool across the financial markets. The same reading logic that flags a reversal on a Bitcoin chart works on the S&P 500, a point worth keeping in mind if you also trade equities (see our comparison of crypto vs stocks).
There are several types of divergence, and each carries a different level of reliability—from strong, high-conviction setups to weak signals best ignored. Understanding which is which is what separates traders who use divergence to capture opportunities from those who get chopped up by false signals.
The Indicators That Reveal Divergence
Divergence is never read from price alone—you need a momentum indicator to compare it against. The four tools below are the ones crypto traders rely on most. RSI is the easiest starting point; MACD and Stochastic add confirmation; volume-based indicators tell you whether conviction is really fading.
| Indicator | Typical setting | What signals divergence | Best used for |
|---|---|---|---|
| RSI (Relative Strength Index) | 14 periods; overbought >70, oversold <30 | Price prints a new high/low but RSI fails to match it | Beginners — the clearest single-line divergence |
| MACD | 12, 26, 9 | Histogram or MACD line makes a lower high while price makes a higher high (or vice-versa) | Confirming momentum shifts on 4H / daily charts |
| Stochastic Oscillator | 14, 3, 3; overbought >80, oversold <20 | %K/%D fail to confirm the new price extreme | Ranging markets and faster, shorter-term signals |
| OBV / Volume | Default | Price rises but volume or On-Balance-Volume falls (weak conviction) | Confirming whether a move has real participation |
Most traders start with RSI because divergence is visually obvious on it, then use MACD as a second opinion. When two independent indicators diverge at the same price level, the signal is materially stronger than either one alone.
Bullish Divergence
A bullish divergence appears when the price of an asset—such as a cryptocurrency or stock—shows signs of decreasing selling pressure after a period of significant decline, or while it sits at a support level considered low. In practice, price grinds to a lower low but the momentum indicator refuses to follow, printing a higher low instead. That mismatch signals a potential reversal to the upside.
Bullish divergence is usually accompanied by weakening selling volume and, often, more positive sentiment from news or fundamentals. Traders combine it with indicators like the Moving Average (MA) or RSI, and with bullish candlestick patterns such as the hammer, morning star, or bullish engulfing, to strengthen the read. The signal tells a trader that a downtrend may be about to flip into an uptrend—useful for deciding when to open a long position with the odds tilted in your favour.
Bearish Divergence
Bearish divergence is the mirror image: it often signals a possible reversal from an uptrend to a downtrend. It typically appears as an asset’s price approaches a resistance area or price ceiling, suggesting buying pressure is weakening even as price pushes higher.
This pattern usually forms after a significant rally whose momentum is starting to fade—frequently the tail end of a Fear of Missing Out (FOMO) surge, where late buyers pile in out of fear of missing further gains. Price keeps rising, but the strength behind it is quietly deteriorating, and the indicator prints a lower high against price’s higher high. When this appears at resistance or after a large move, traders may consider taking profit, selling the asset, or opening a short position in the futures market.
The Four Types of Divergence
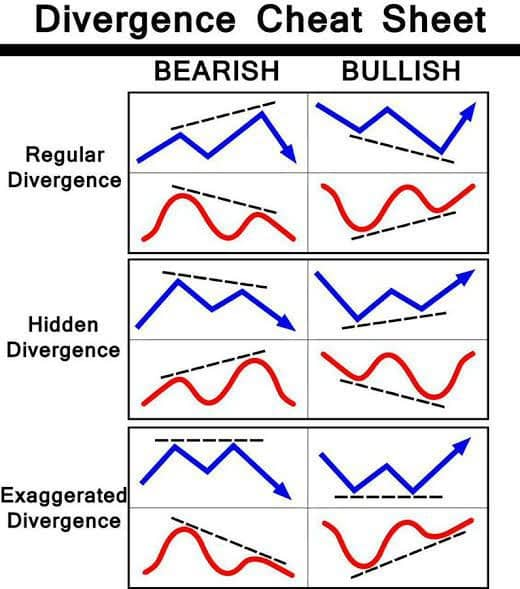
Divergence splits into two families—regular (reversal) and hidden (continuation)—each with a bullish and a bearish version. Knowing which of the four you are looking at tells you whether to fade the trend or ride it.
Regular Divergence: Signal of Potential Trend Reversal
Regular divergence points to a possible trend reversal. It is most useful for identifying moments when an ongoing trend is likely to turn, especially at a significant support or resistance zone. It divides into two types:
- Bullish Regular Divergence: a potential change from a downtrend to an uptrend. It occurs when price forms a lower low while the momentum indicator (RSI or MACD) forms a higher low—a sign that selling pressure is weakening even though price is still falling.
- Bearish Regular Divergence: a potential reversal from an uptrend to a downtrend. It occurs when price forms a higher high but the indicator registers a lower high—buying momentum is fading even as price rises.
Hidden Divergence: Signal of Trend Continuation
Unlike regular divergence, hidden divergence signals a potential trend continuation. It confirms that an ongoing trend still has strength, helping traders stay in a winning position rather than exit early. It also has two types:
- Bullish Hidden Divergence: the uptrend is likely to continue. Price forms a higher low while the indicator forms a lower low—the market still has fuel to push higher.
- Bearish Hidden Divergence: the downtrend is likely to continue. Price forms a lower high while the indicator forms a higher high—selling pressure remains dominant.
Keep the cheat sheet below within reach until the four patterns become second nature:
| Divergence type | Price action | Indicator (RSI/MACD) | What it signals |
|---|---|---|---|
| Regular Bullish | Lower low | Higher low | Downtrend may reverse up — look to go long |
| Regular Bearish | Higher high | Lower high | Uptrend may reverse down — take profit or short |
| Hidden Bullish | Higher low | Lower low | Uptrend likely continues — stay long |
| Hidden Bearish | Lower high | Higher high | Downtrend likely continues — stay short |
How to Spot Divergence in Crypto: Step by Step
Here is a repeatable process for using divergence in a real trading situation:
- Choose the cryptocurrency to trade — pick a liquid asset you want to analyse. A regulated, liquid venue matters; see our guide to the best crypto exchanges for day trading.
- Add your indicators — apply RSI, MACD, or the Stochastic Oscillator to the chart so you have a momentum reference to compare against price.
- Assess the current trend — is price in an uptrend, a downtrend, or ranging? Divergence only means something in context.
- Spot the divergence — for bullish, look for a lower low in price against a higher low on the indicator; for bearish, look for a higher high in price against a lower high on the indicator.
- Verify the signal — confirm with a second indicator, a chart pattern, or a break of structure. The more aligned signals you have, the stronger the setup.
- Set entry and exit levels — define your entry, target, and stop-loss before you place the trade, based on nearby support/resistance.
- Monitor and adjust — watch how price behaves after entry and trail your stop-loss to protect profits or cap losses as the move develops.
Common Divergence Trading Mistakes (and How to Avoid Them)
Divergence gets a bad reputation mostly because of how it is traded, not because of the signal itself. These are the errors that cause the majority of failed divergence trades:
- Trading it in isolation. Divergence is a warning, not a trigger. Acting on it without a confirming break of structure, candlestick signal, or volume shift is the single most common way to get faked out.
- Entering too early. Divergence can persist for a long time—an overbought market can stay overbought. Wait for price to actually confirm the turn (for example, a break of the recent swing) rather than trying to pick the exact top or bottom.
- Fighting a strong trend. A single bearish divergence inside a powerful uptrend often just resets momentum before another leg up. Regular divergence works best at major support/resistance, not in the middle of a runaway move.
- Using timeframes that are too low. Divergence on a 1–5 minute chart is mostly noise. The 4-hour and daily charts filter out far more false signals.
- Ignoring risk management. Even a textbook divergence can fail. Without a pre-set stop-loss and sensible position size, one bad trade can undo several good ones.
A simple confirmation checklist before you act on divergence: the signal appears on a higher timeframe, it forms at a meaningful support or resistance level, a second indicator agrees, price breaks structure in your direction, and your stop-loss is already defined. If you cannot tick most of these boxes, it is usually better to wait.
Real Divergence Examples in the Crypto Market
Divergence can appear on any pair and any timeframe. The two historical examples below illustrate how the pattern played out on real crypto charts.
SUI/USDT (Bullish Divergence)
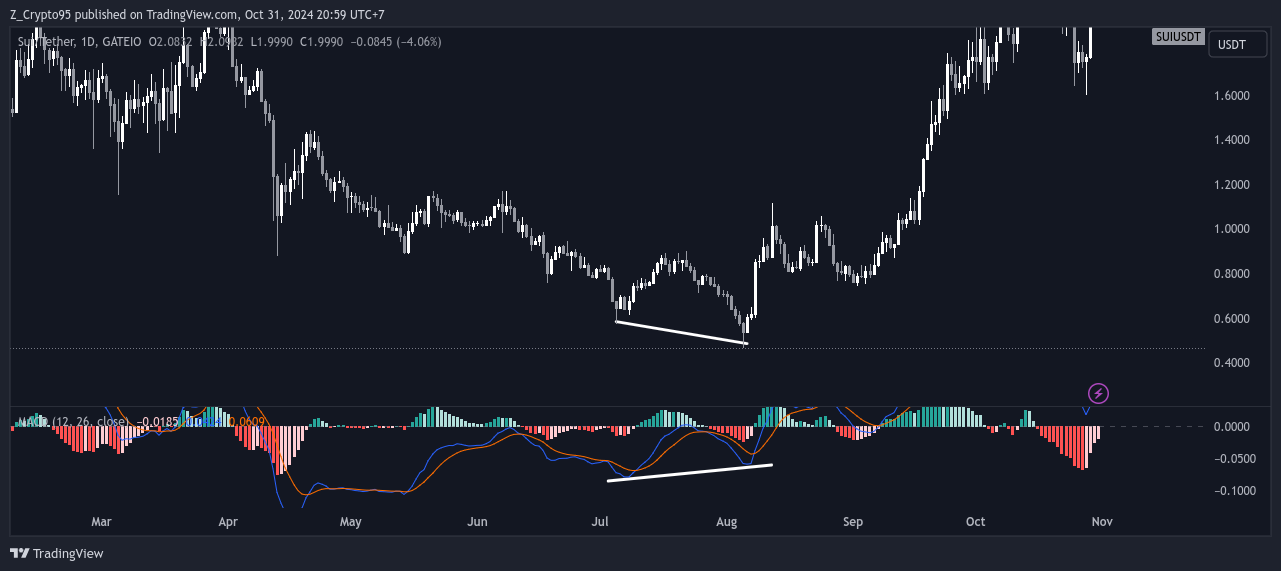
Here a bullish divergence formed: SUI’s price carved out a lower low on the chart while MACD printed a higher low. That mismatch is the classic bullish-divergence signature—and price subsequently rallied from around $0.54 toward $2.37, roughly a three-fold move. It is a clean illustration of momentum quietly turning up while price was still making new lows.
STX/USDT (Bearish Divergence)
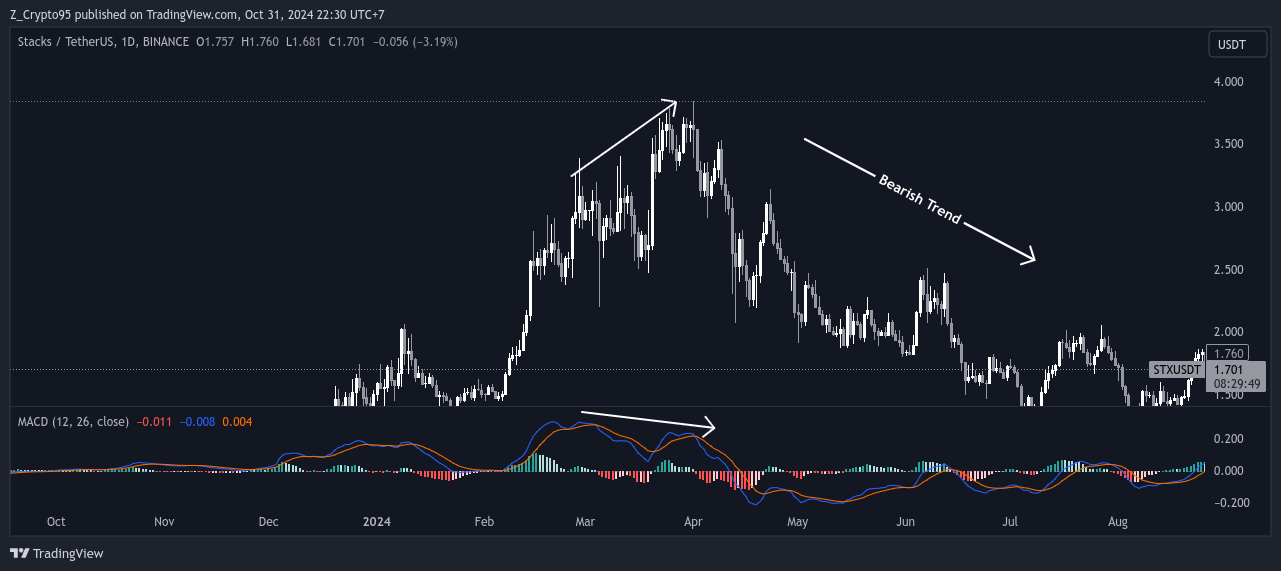
Stacks (STX) on the daily timeframe formed a bearish divergence after a powerful run in early 2024—a rally that, measured from its 2023 lows, had multiplied the price many times over. As price pushed to higher highs, momentum was already fading, and the trend rolled over into the following quarter. A trader reading the divergence could have taken profit near the highs instead of round-tripping the decline. For broader market context, see our overview of Bitcoin price predictions.
Read also: Top 5 Crypto Whale Tracker Tools to Monitor Market Movements in Real-Time
Managing Risk When Trading Divergence
Because even a well-formed divergence can fail 30–40% of the time, risk management is what keeps you in the game. Three habits matter most: always place a stop-loss just beyond the swing high or low that formed the divergence; size each position so a single loss costs only a small, fixed percentage of your account (many traders cap this at 1–2%); and avoid stacking multiple correlated crypto trades on the same signal. Divergence is a probability edge, not a guarantee—treat it that way. For a deeper playbook, read our guide on ways to manage risk in crypto trading, and if you are refining a wider approach, our breakdown of Bitcoin trading strategies pairs well with divergence-based entries.
Indicator settings and divergence definitions verified August 2026. The chart examples above are historical illustrations, not predictions—always confirm live data on your own trading platform before acting.
Conclusion
Divergence is a powerful analytical tool for spotting potential trend changes, but it rewards discipline and punishes shortcuts. Read on its own it produces plenty of false signals; combined with price structure, volume, a second indicator, and strict risk management, it becomes one of the most useful edges a crypto trader can develop.
Learn the four patterns until you can recognise them instantly, insist on confirmation before you enter, and let your stop-loss—not your hope—decide when a trade is wrong. That is how divergence goes from a source of frustration to a genuine part of a well-rounded trading strategy.
Frequently Asked Questions
Disclaimer: This article is provided by KayaToday for educational purposes only and does not constitute financial or investment advice. Cryptocurrency trading carries substantial risk, including the loss of capital. Always do your own research and consider consulting a licensed financial adviser before making trading decisions.